
다양한 Colletotrichum 종이 혼재된 고추탄저병균 집단의 QoI 저항성 모니터링을 위한 cDNA 기반 정량적 염기서열 분석법

초록
본 연구는 최근 국내 고추 재배지에서 발생하는 탄저병균의 종 다양성 변화에 대응하여, QoI 살균제 저항성 모니터링을 위한 기존 정량적 염기서열 분석법(Quantitative Sequencing, QS)을 개선하고자 수행되었다. 기존 gDNA 기반 QS법은 Colletotrichum gloeosporioides 종 복합체 내 인트론 구조 차이로 인해 일부 종의 cytb 유전자 증폭이 불안정한 한계가 있었다. 이를 해결하기 위해 cDNA를 주형으로 사용하고, 다양한 종에 범용성을 갖는 RF-CYT1A/RF-CYT2B 프라이머 세트를 적용한 개선된 QS법을 확립하였다. 인공 병반 시료를 이용한 검증 결과, 기존 방법은 실제 저항성 비율과의 결정계수(R2)가 0.8826이었으나, 개선된 방법은 0.9973의 높은 상관관계를 나타내어 분석의 정확도와 재현성이 현저히 향상되었다. 본 연구에서 확립된 cDNA 기반 QS 분석 시스템은 다종의 Colletotrichum이 혼재하는 포장 집단의 QoI 저항성 빈도를 신속하고 정확하게 모니터링하는데 유용하게 활용될 것으로 판단된다.
Abstract
In response to recent changes in species diversity, we performed this study to improve the quantitative sequencing (QS) method to monitor Quinone-outside inhibitor (QoI) resistance in Colletotrichum populations causing chili pepper anthracnose. The conventional gDNA-based QS method had limitations in the amplification stability of certain species, such as the Colletotrichum gloeosporioides species complex, due to intron structure variations within the cytochrome b (cytb) gene. To overcome this, we developed an improved QS method with cDNA as a template and a universal primer set (RF-CYT1A/RF-CYT2B). Although the conventional method had a coefficient of determination (R2) of 0.8826 between actual resistance ratios and QS results when using artificial lesion samples for validation, our improved method significantly enhanced accuracy and reproducibility with an R2 of 0.9973. Our improved cDNA-based QS system will be a valuable tool to rapidly and accurately monitor QoI resistance frequencies of diverse Colletotrichum species that coexist in field populations.
Keywords:
Chili pepper anthracnose, Colletotrichum spp., Quinone-outside inhibitor (QoI) fungicide resistance, cDNA-based quantitative sequencing키워드:
고추 탄저병, QoI 살균제 저항성, cDNA 기반 정량적 염기서열 분석법서 론
고추(Capsicum annuum L.)는 한국의 대표적인 채소 작물로서 김치, 고추장 및 각종 양념류의 원료로 널리 이용되며, 한국인의 식생활과 밀접한 관련을 가진 중요한 농산물이다(Hong and Kim, 2013). 고추 재배 시 발생하는 여러 병해 가운데 탄저병(anthracnose)은 피해 규모가 큰 대표적인 병해로, 주로 Colletotrichum 속 병원균 복합체에 의해 발생한다. 탄저병에 감염된 열매에서는 부패와 품질 저하가 발생하여 직접적인 수량 감소와 상품성 하락을 초래하며, 저장 및 유통 과정에서도 열매 부패를 유발하여 수확 후 손실을 증가시키는 주요 요인으로 알려져 있다(Ali et al., 2016; Dean et al., 2012; Islam et al., 2020; Saxen et al., 2016).
고추 탄저병 방제를 위해서 살균제를 사용하는 화학적 방제 방법은 높은 방제 효과와 경제성을 바탕으로 중요한 병 관리 수단이 되고 있다(Begum et al., 2015; Saxen et al., 2016). 그러나 효과가 우수한 동일한 살균제를 장기간 반복하여 사용하다보니 병원균 집단 내에서 살균제에 대한 저항성을 획득한 개체가 선택적으로 증가하여 약효가 감소하는 문제가 발생하고 있다(Gisi et al., 2002; Corkley et al., 2022). 특히 Quinone-outside inhibitor (QoI)에 속하는 살균제는 미토콘드리아 전자전달계의 복합체 III에 존재하는 cytochrome b (cytb) 단백질의 Qo site에 결합하여 전자전달을 저해함으로써 ATP 생성을 억제하는 단일 작용점을 갖는 살균제로, 다양한 작물 병해에 우수한 방제 효과를 나타내어 널리 사용되어 왔다(Bartlett et al., 2002; Gisi et al., 2002; Zakharychev and Kovalenko, 1998). 그러나 단일 작용점 특성으로 인해 돌연변이 발생에 취약하며, 현재까지 G143A, F129L, G137R과 같은 점 돌연변이에 의한 저항성 기작이 다양한 식물병원균에 보고되었다(Dorigan et al., 2023; Gisi et al., 2002; Gisi and Sierotzki, 2008; Sierotzki, 2015). 이들 변이는 Qo site의 구조를 변화시켜 살균제의 결합을 방해함으로써 저항성을 유발한다. 국내에서도 Colletotrichum scovillei를 비롯한 주요 고추탄저병균에서 QoI 저항성 균주의 비율이 증가하고 있어 체계적이며 지속적인 저항성 모니터링의 필요성이 강조되고 있다(Isa et al., 2026).
QoI 저항성 검정에는 cytochrome b 유전자의 변이를 검출하는 다양한 분자생물학적 기법이 활용되고 있다. PCR-RFLP, allele-specific PCR (AS-PCR), 고해상도 융해곡선(high-resolution melting, HRM) 분석 및 real-time PCR 등은 저항성 관련 점 돌연변이를 신속하게 검출할 수 있어, 다양한 식물병원균의 저항성 모니터링에 적용되고 있다(Forcelini et al., 2018; Isa and Kim, 2022; Ishii et al., 2007; Luo et al., 2007). 이러한 분자 진단 기법은 단순히 저항성의 존재 여부를 확인하는 데 그치지 않고, 병원균 집단 내 저항성 빈도의 변화와 지역별 분포 양상을 신속하고 정확하게 파악하여, 효율적인 살균제 관리 전략 수립에 필요한 기초 자료를 제공한다(Fernández-Ortuño et al., 2008).
정량적 염기서열 분석법(Quantitative Sequencing, QS)은 염기서열 크로마토그램에서 특정 대립유전자의 빈도를 정량하는 방법으로, 포장 집단의 저항성 변이 발생 비율을 신속하게 평가할 수 있는 기술이다(Isa et al., 2026; Kim et al., 2011; Kwon et al., 2008). QS 분석법은 높은 재현성과 확장성을 가지며 대규모 집단의 분석에 적합하여, 병원균 집단의 살균제 저항성 모니터링을 위한 경제적이고 실용적인 방법으로 평가되고 있다(Cao et al., 2011; Isa et al., 2026; Seong et al., 2010). Isa 등(2026)은 QS 분석법을 이용하여 C. scovillei 집단의 QoI 저항성 비율을 신속하게 추정할 수 있음을 보고하였다.
그러나 최근 국내 고추탄저병균 집단에서는 C. scovillei 뿐만 아니라 C. fructicola, C. aenigma, C. gloeosporioides, C. truncatum 등 다양한 Colletotrichum 종이 혼재하여 발생하고 있다(An and Kim, 2026; Shin et al., 2025). 이러한 종 다양성의 증가는 기존 gDNA 기반 QS 분석법의 적용 정확도에 영향을 미칠 수 있다. 특히 Colletotrichum 종 간 cytb 유전자에서 인트론 존재 여부에 따른 구조적 차이는 PCR 증폭 효율에 영향을 미쳐 일부 종에서는 정확한 변이 분석을 어렵게 한다. 따라서 다양한 Colletotrichum 종이 공존하는 실제 포장 집단에 적용할 수 있는 보다 정확하고 재현성 높은 저항성 평가 방법의 확립이 요구된다.
본 연구에서는 기존 정량적 염기서열 분석법의 한계를 개선하여 QoI 살균제 저항성 검정의 정확성과 재현성을 향상시키기 위한 개선된 방법을 확립하고자 하였다. 이를 위하여 기존 QS 분석법에서 사용되던 프라이머 세트와 주형 핵산의 한계를 개선하기 위하여 새로운 primer 세트와 cDNA 기반 증폭 시스템을 적용하였으며, 이를 통해 다양한 Colletotrichum 종이 혼재하는 포장 집단에서도 적용 가능한 QS 분석법을 확립하고자 하였다.
재료 및 방법
시료 채집 및 병원균 분리
탄저병 감염 고추 열매의 채집과 병원균 분리를 위하여 2022년부터 2024년까지 경기도, 강원도, 충청북도, 충청남도, 경상북도, 전라북도의 고추 재배지에서 탄저병 병징을 보이는 고추 열매를 채집하였다. 포장당 5−10개의 고추 시료를 확보하였으며, 2022년 74포장, 2023년 79포장, 2024년 70포장에서 각각 651개, 711개 및 613개의 탄저병이 발생한 고추 열매를 채집하였다. 병든 고추 열매는 병원균 분리와 정량적 염기서열 분석(Quantitative Sequencing, QS)을 위한 핵산 추출에 이용하였다. 병원균 분리를 위하여 멸균한 이쑤시개로 병반에 형성된 포자를 떼어 300 μg/mL의 streptomycin이 첨가된 멸균 증류수에 현탁하였다. 포자 현탁액의 포자 밀도를 hemocytometer (Marienfeld Superior, Germany)로 관찰하며 1×10⁴−105개/mL로 조정한 뒤, 300 µg/mL의 streptomycin이 첨가된 PDA (DifcoTM, Becton, Dickinson and Company, USA) 배지에 20 µL씩 도말하였다. 도말한 배지는 25℃의 암조건에서 3일간 배양한 후, 배지에 형성된 단균총을 떼어 새로운 PDA 배지에 접종하였다. PDA 배지를 25℃의 암조건 배양하며, 균총의 선단부에서 직경 3 mm의 균사 조각을 떼어내어 순수 배양체의 보관에 사용하였다. 병원균의 장기간 보관을 위하여 떼어낸 균사 조각 12개를 20% glycerol (Merck, Darmstadt, Germany) 용액 1.7 mL가 들어 있는 2 mL Cryovial® (Simport Scientific Inc., Beloeil, QC, Canada)에 넣고, -70℃의 초저온 냉동고에서 보관하였다. 추가로 2 mL Cryovial®에 PDA 사면배지를 제조한 후 직경 3 mm 균사 조각을 접종하여 25℃에서 3일간 배양하였다. 형성된 균총 위에 멸균한 유동 파라핀(MOLKANG, Korea)을 첨가한 후 실온에서 보관하면서 실험에 사용하였다.
QoI 살균제 저항성 검정을 위한 대량 한천희석법
대량 한천희석법을 이용하여 국내 고추 재배 포장의 QoI 저항성 균주 비율을 조사하고, QS 분석 결과와 상관성을 분석하였다. 대량 한천희석법은 2022년부터 2024년까지 고추 탄저병이 발생한 고추 열매에서 분리한 병원균을 대상으로 수행하였다. 페트리디쉬(직경 150 mm, SPL Life Sciences, Korea)에 pyraclostrobin을 10 µg/mL 농도로 첨가한 PDA 배지와 pyraclostrobin을 첨가하지 않은 PDA 배지를 각각 준비하였다. 각 접시에는 시험 균주 10개에서 떼어낸 직경 3 mm 균사 조각을 동일한 간격으로 접종하였다. 병원균을 접종한 배지는 25℃의 암조건에서 5일간 배양한 후, 디지털 캘리퍼(BD-DC150P, BLUETEC)를 이용하여 균총의 직경을 측정하였다. 균사 생장 억제율(%)은 아래 식을 이용하여 계산하였다.
균사 생장 억제율이 55.5% 이상인 균주는 감수성으로, 55.5% 미만인 균주는 저항성으로 판정하였다. 이 기준은 EC50 값과 cytb 유전자의 G143A 돌연변이 유무를 바탕으로 설정한 An and Kim (2026)의 기준에 따라 적용하였다. 모든 실험은 3반복으로 실시하였다.
포장 내 Colletotrichum 속의 종 분포 비율 반영 실험 시료 제작
포장에 분포하는 다양한 Colletotrichum 종을 비율별로 조합하여 인공 접종한 고추 열매를 실험 시료로 사용하였다. 접종원으로 사용할 pyraclostrobin 감수성 및 저항성 균주를 Table 1과 같이 선발하였다. 선발한 각 균주에서 직경 3 mm의 균사 조각을 떼어내어 PDA 배지에 접종한 후, 25℃ 암조건에서 10일간 배양하였다. 배양 후 멸균한 슬라이드 글라스를 이용하여 균총 표면의 공중균사를 제거하고, 20℃에서 12시간 간격으로 2일간 근자외선을 조사하여 포자 형성을 유도하였다. 형성된 포자는 PDA 배지에 멸균 증류수 10 mL를 첨가한 후 멸균한 슬라이드 글라스로 균총 표면을 긁어 수확하였다. 수확한 포자 현탁액은 4겹 거즈에 여과하여 균사와 이물질을 제거하였으며, 3,000 rpm에서 10분간 2회 원심분리하여 세척하였다. 포자 현탁액의 최종 농도는 5 × 10⁵개/mL로 조정하였다.

Colletotrichum isolates used for the comparison of conventional and improved quantitative sequencing (QS) methods and for the preparation of artificial lesion samples
인공 접종에 사용한 고추 열매는 1% 차아염소산나트륨 용액으로 1분간 표면 살균한 후 멸균 증류수로 세척하였다. 열매 표면에 혈당침(Lancets, SD BIOSENSOR, Korea)을 이용하여 상처를 형성하고, 각 상처 부위에 포자 현탁액 20 μL를 점적하여 접종하였다. 접종한 열매는 25℃에서 5일간 습실 처리한 후, 뚜껑을 열고 동일한 온도에서 추가로 5일간 보관하며 병반 형성을 유도하였다. 병반이 충분히 형성된 열매는 균주별로 구분한 후 5 mm 코르크 보어를 이용하여 병반 조직을 떼어내었다. 병반 조직은 2024년 국내 고추 재배 포장에서 채집한 고추 열매에서 확인된 Colletotrichum 종의 분포 비율을 반영하여 Table 2에 제시한 비율별로 Colletotrichum 종의 병반 조직을 혼합하여 인공 시료를 제작하였다. 각 조합의 인공 시료는 2024년에 분리한 Colletotrichum 종의 각 지역별 분리 비율을 반영하여 구성하였다.
Composition of artificial lesion samplesa) for validating the improved QS method across various Colletotrichum species mixtures
gDNA와 RNA의 추출
고추 열매의 탄저병 병반 부위에서 떼어낸 직경 5 mm의 병반 조직을 직경 0.1 mm의 glass beads가 담긴 2 mL standard microtube (DeNovoTM, Seoul, Korea)에 넣고, -70℃에서 24시간 이상 동결시켰다. 동결한 시료는 동결건조기 (FD8508, IlshinBioBase, Korea)를 이용하여 동결 건조한 후, bullet blender homogenizer (BBY24M, Next Advance, U.S.A)를 이용하여 마쇄하였다. 마쇄한 시료로부터 Exgene Plant SV mini kit (GeneAll Biotechnology, Seoul, Korea)를 이용하여 gDNA를 추출하였다.
또한 Table 1의 균주를 접종하여 얻은 병반 조직을 Table 2와 같은 비율로 혼합한 23종의 인공 시료에서도 gDNA와 total RNA를 추출하였다. gDNA는 위와 동일한 방법으로 추출하였으며, total RNA는 Hybrid-RTM kit (GeneAll Biotechnology, Seoul, Korea)를 이용하여 추출하였다. 추출한 gDNA와 total RNA의 농도와 순도는 마이크로볼륨 분광광도계(OPTIZEN Nano Q, K Lab, Korea)로 측정하였으며, 모든 시료는 50 ng/μL로 농도를 조정하여 실험에 사용하였다.
Cytochrome b 유전자 증폭
cytb 유전자의 143번째 아미노산 부위를 포함하는 영역을 증폭하기 위하여 gDNA와 total RNA로부터 합성한 cDNA를 주형으로 사용하였다. Total RNA로부터 cDNA를 합성하기 위하여 총 20 μL 반응액을 준비하였다. 반응액은 5× Reverse Transcription Master mix (ELPIS-BIOTECH, Korea) 4 μL, total RNA 5 μL, dH2O 11 μL로 구성하였다. 반응액은 37℃에서 1시간 동안 역전사 반응을 수행하여 cDNA를 합성한 후, 94℃에서 5분간 반응시켜 reverse transcriptase를 불활성화하였다.
cytb 유전자의 증폭을 위하여 Cacytb-P2 (CATAGTAAYACAGCTTCT)/Cacytb-R (GGAATAGATCTTAATATAGC) 프라이머(Kwak, 2016)와 RF-CYT1A (AYAGAGCTCCWAGAACWTTAG)/RF-CYT2B (GAAACACCTAAWGGGTTACTTGA) 프라이머(Abdulkareem et al., 2024)를 사용하여 효율성을 비교하였다. gDNA를 주형으로 한 PCR 반응액은 5× Master Mix (EzPCRTM HS 5× PCR Master Mix, ELPIS-BIOTECH, Korea) 4 μL, gDNA 2 μL, forward primer (10 pmol/μL) 1 μL, reverse primer (10 pmol/μL) 1 μL, dH2O 12 μL를 혼합하여 최종 반응액 20 μL로 준비하였다. cDNA를 주형으로 한 PCR 반응액은 gDNA 대신 cDNA 5 μL를 사용하고, dH2O의 양을 9 μL로 조정하여 최종 반응액 20 μL로 준비하였다.
Cacytb-P2/Cacytb-R 프라이머의 PCR 반응 조건은 94℃에서 5분간 pre-denaturation을 수행한 후, 94℃에서 40초간 denaturation, 37℃에서 40초간 annealing, 72℃에서 50초간 extension을 35회 반복하였으며, 마지막으로 72℃에서 5분간 final extension을 수행하였다(Kwak, 2016). RF-CYT1A/RF-CYT2B 프라이머의 PCR 반응 조건은 95℃에서 5분간 pre-denaturation을 수행한 후, 95℃에서 1분간 denaturation, 55℃에서 30초간 annealing, 72℃에서 1분간 extension을 35회 반복하였으며, 마지막으로 72℃에서 5분간 final extension을 수행하였다(Abdulkareem et al., 2024). PCR 증폭산물은 1% agarose gel에서 0.5× Tris-borate-EDTA (TBE) buffer를 사용하여 100 V에서 40분간 전기영동하였다. 이후 UV transilluminator (NaBI set, NeoScience, Korea)를 이용하여 증폭 여부를 확인하였다.
정량적 염기서열 분석(Quantitative Sequencing, QS)
PCR 산물은 ExpinTM PCR SV kit (GeneAll Biotechnology, Seoul, Korea)를 이용하여 정제한 후 Macrogen (Daejeon, Korea)에 의뢰하여 염기서열 분석을 수행하였다. 염기서열 데이터는 BioEdit Sequence Alignment Editor (version 7.2.5)를 이용하여 확인하였으며, cytb 유전자의 143번째 코돈에서 G143A 변이에 해당하는 G와 C 염기의 피크 높이를 측정하여 저항성 및 감수성 대립유전자의 상대적 신호 강도를 산출하였다. 이를 바탕으로 저항성 대립유전자 빈도를 계산하였다.
국내 고추 재배 포장에서 사용되어 온 기존 QS 분석법의 정확성과 신뢰성을 평가하기 위하여, 시료를 채집한 각 포장별로 대량 한천희석법을 통해 조사한 저항성 균주의 비율과 QS 분석 결과 간의 상관성을 분석하였다. 또한 기존 방법과 개선된 QS 분석법의 효율을 비교하기 위하여 23종의 인공 병반 시료를 대상으로 QS 분석을 수행하였다. 상관분석을 위하여 Microsoft Excel (version 2205, Microsoft Corp., Redmond, WA, USA)을 이용하여 선형회귀분석을 수행하고 결정계수(R2)를 산출하였다.
결 과
Pyraclostrobin 저항성 모니터링을 위한 QS 분석법의 신뢰도 평가
탄저병이 발생한 고추 포장에서 채집한 병반 조직의 QS 분석법 결과와 대량 한천희석법 결과의 상관성을 비교한 결과, 2022년부터 2024년까지 결정계수(R2)는 각각 0.8068, 0.9424, 0.8438로 나타났으며, 2022년과 2024년의 결정계수가 2023년에 비해 낮게 나타났다(Fig. 1). 한편, C. fructicola의 분리 비율이 100.0%였던 2024년의 천안 포장에서는 cytb 유전자 증폭산물이 확인되지 않아 저항성 대립유전자 빈도를 산출할 수 없었으며, 해당 포장은 상관분석에서 제외하였다. 2024년 C. fructicola, C. aenigma, C. gloeosporioides와 같은 C. gloeosporioides species complex에 속하는 종이 분리된 9개 포장 중 천안을 제외한 8개 포장에 대하여 상관성을 분석한 결과, R2 값은 0.8397로 나타났다(Fig. 2A). 또한 QS 분석 결과와 대량 한천희석법 결과 간 저항성 빈도의 차이가 큰 포장일수록 C. gloeosporioides species complex의 분리 비율이 높게 나타났다(Fig. 2B, C). 두 분석법 간 차이가 60.0%였던 익산 포장에서는 C. fructicola, C. aenigma, C. gloeosporioides의 분리 비율이 각각 60.0, 10.0, 10.0%로 나타났다. 차이가 38.0%였던 안동 포장에서는 C. fructicola의 분리 비율이 57.1%로 나타났다. 반면 완주 포장에서는 C. nymphaeae, C. fioriniae, C. fructicola의 분리 비율이 각각 20.0, 10.0, 70.0%였으며, 모두 감수성 균주로 확인되었고, QS 분석법과 대량 한천희석법 모두 저항성 비율은 0.0%로 나타났다. 이와 같이 고추에서 분리되는 Colletotrichum 종의 다양성이 증가함에 따라, 기존 QS 분석법과 대량 한천희석법 간의 차이가 크게 나타나는 경향을 보였다.
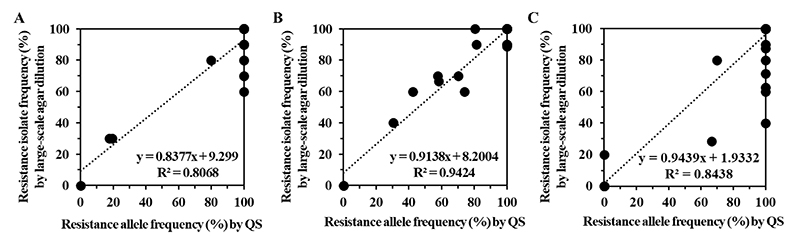
Correlation between QoI resistance allele frequencies determined by conventional gDNA-based quantitative sequencing (QS) and resistance isolate frequencies determined by the large-scale agar dilution assay. Data were obtained from Colletotrichum populations collected from diseased chili pepper fruits in (A) 2022 (n=74), (B) 2023 (n=79), and (C) 2024 (n=69). Each symbol represents an individual field population, and 'n' indicates the total number of isolates tested in each year.
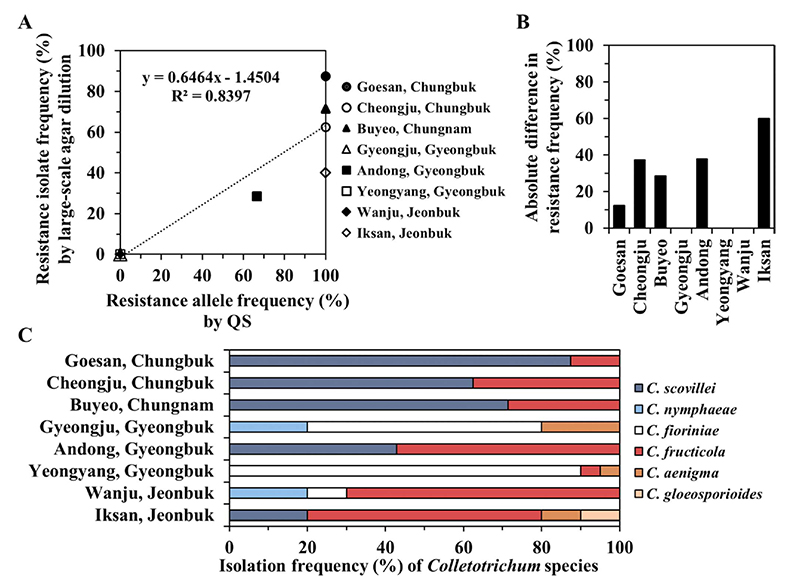
Relationship between species composition and the accuracy of conventional gDNA-based quantitative sequencing (QS) analysis in eight field populations where species belonging to the Colletotrichum gloeosporioides species complex were detected in 2024. (A) Correlation between resistance allele frequencies determined by conventional QS and resistance isolate frequencies determined by the large-scale agar dilution assay. Symbols represent individual field populations. (B) Absolute difference in resistance frequency between conventional QS analysis and the large-scale agar dilution assay. (C) Isolation frequencies of Colletotrichum species in each field population.
프라이머와 주형에 따른 cytb 유전자 증폭 효율 비교
여러 종의 Colletotrichum에서 cytb 유전자의 증폭 효율을 비교하기 위하여 기존 QS 분석법에 사용된 Cacytb-P2/Cacytb-R 프라이머와 RF-CYT1A/RF-CYT2B 프라이머를 이용하여 각 균주로부터 추출한 gDNA와 total RNA로부터 합성한 cDNA를 주형으로 PCR을 수행하였다. gDNA를 주형으로 하여 Cacytb-P2/Cacytb-R 프라이머를 사용한 경우에는 C. gloeosporioides species complex에 속하는 균주들에서 증폭산물이 확인되지 않았다(Fig. 3A). 동일한 프라이머를 사용하고 주형을 cDNA로 교체한 경우, 일부 균주에서만 증폭산물이 확인되었으며, 일부 균주에서는 이중 밴드가 형성되거나 증폭산물이 관찰되지 않았다(Fig. 3B). RF-CYT1A/RF-CYT2B 프라이머를 사용하고 gDNA를 주형으로 하였을 때에도 C. gloeosporioides species complex에 속하는 균주들에서는 증폭산물이 확인되지 않았지만(Fig. 3C), cDNA를 주형으로 하고 RF-CYT1A/RF-CYT2B 프라이머를 사용한 경우에는, 모든 균주에서 325 bp 크기의 cytb 유전자 증폭산물이 확인되었다(Fig. 3D).
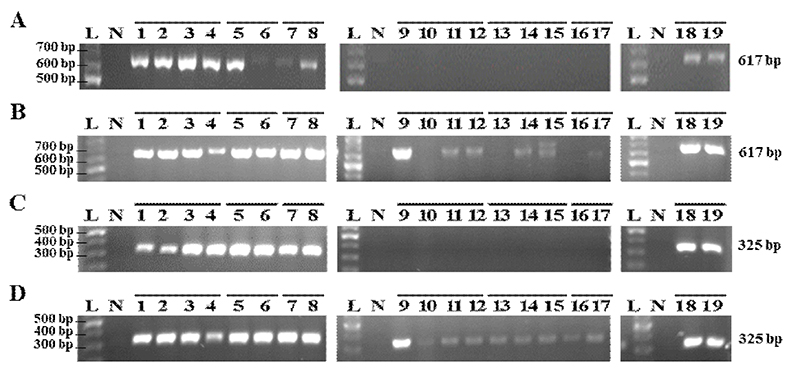
Amplification of the cytb gene from various Colletotrichum species using different primer-template combinations. (A) Cacytb-P2/Cacytb-R primers with gDNA, (B) Cacytb-P2/Cacytb-R primers with cDNA, (C) RF-CYT1A/RF-CYT2B primers with gDNA, and (D) RF-CYT1A/RF-CYT2B primers with cDNA. Lanes: L, 100 bp Plus DNA ladder; N, negative control; 1-4, C. scovillei (GWHS1-7, GWHS1-8, GWPC2-5, GPIG3-4); 5-6, C. nymphaeae (JBJJ1-6, JBJJ1-8); 7-8, C. fioriniae (JBJJ1-7, GBYY3-1); 9-12, C. fructicola (JBIS1-10, CNCA1-1, JBIS1-1, 22BSD2); 13-15, C. aenigma (GBYY3-3, GBGJ1-1, JBIS1-4); 16-17, C. gloeosporioides (22UGM9, JBIS1-3); 18-19, C. truncatum (JBWJ1-1, JBJS2-2).
인공 병반 시료에서의 cytb 유전자 증폭 및 QS 분석 정확도 비교
고추 열매에 Colletotrichum 종별로 선발한 균주를 인공 접종하여 얻은 동일한 크기의 병반을 Table 2의 비율대로 혼합한 23종의 인공 병반 시료를 사용하여 cytb 유전자를 증폭하였다. 모든 시료에서 추출한 gDNA를 주형으로 하고 Cacytb-P2/Cacytb-R 프라이머를 사용하고 PCR한 결과, C. gloeosporioides species complex에 속하는 종을 단독으로 접종하여 제작한 Table 2의 5-9번의 시료에서는 cytb 유전자가 증폭되지 않았다(Fig. 4A). 반면, C. acutatum species complex에 속하는 종에 의한 병반 조직이 포함된 혼합 시료에서는 617 bp의 증폭산물이 확인되었다(Fig. 4B). RF-CYT1A/RF-CYT2B 프라이머를 사용하고 cDNA를 주형으로 하여 증폭한 경우에는 모든 인공 병반 시료에서 325 bp의 cytb 유전자 증폭산물이 확인되었다(Fig. 4C, D).
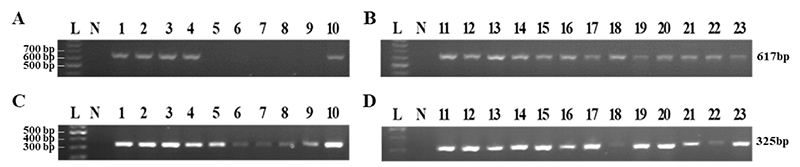
Gel electrophoresis showing PCR amplification of gDNA and cDNA extracted from single and mixed lesion tissues of various Colletotrichum species using primer sets Cacytb-P2/Cacytb-R and RF-CYT1A/RF-CYT2B. (A, C) Single lesion tissues, and (B, D) Mixed lesion tissues. (A, B) gDNA amplified with primers Cacytb-P2/Cacytb-R, and (C, D) cDNA amplified with primers RF-CYT1A/RF-CYT2B. Lanes: L, 100 bp Plus DNA ladder; N, negative control; 1, GWHS1-7; 2, GPIG3-4; 3, JBJJ1-6; 4, JBJJ1-7; 5, CNCA1-1; 6, JBIS1-1; 7, GBGJ1-1; 8, JBIS1-4; 9, JBIS1-3; 10, JBWJ1-1; 11, GWHS1-7+GPIG3-4; 12-14, GPIG3-4+CNCA1-1 mixed at different lesion ratios (14:6 for lane 12, 18:2 for lane 13 and 11:9 for lane 14); 15, GWHS1-7+GPIG3-4+JBIS1-1; 16, JBJJ1-6+JBJJ1-7+CNCA1-1; 17, JBJJ1-6+JBJJ1-7+GBGJ1-1; 18, JBJJ1-7+CNCA1-1+GBGJ1-1; 19, GWHS1-7+CNCA1-1+JBIS1-1+JBIS1-4+JBIS1-3; 20, GPIG3-4+JBJJ1-7+CNCA1-1; 21, GPIG3-4+JBWJ1-1; 22, CNCA1-1+JBWJ1-1; 23, JBJJ1-6+CNCA1-1. The detailed composition and mixing ratios of the lesion samples for lanes 1-23 are identical to those described in Table 2.
기존에 확립했던 QS 분석법과 개선한 QS 분석법의 정확도를 비교하기 위하여, QS 분석 결과와 접종원으로 사용한 감수성 및 저항성 병반 조직의 실제 구성 비율 간의 상관성을 분석하였다. 기존 QS 분석법에서는 10개의 단독 병반 시료 중 C. fructicola 감수성 및 저항성 균주, C. aenigma 감수성 및 저항성 균주, 그리고 C. gloeosporioides 감수성 균주를 접종한 5개 시료에서 cytb 유전자 증폭산물이 확인되지 않아 저항성 대립유전자 빈도를 산출할 수 없었으며, 해당 시료를 제외한 18개 시료를 대상으로 상관분석을 수행하였다. 그 결과, 실제 저항성 비율과 QS 분석 결과 간의 오차 범위는 0.0-30.3%였으며, R2 값은 0.8826으로 나타났다 (Fig. 5A). 반면, 개선된 QS 분석법을 적용한 결과 총 23종 시료 중 10종 시료는 두 방법 모두에서 저항성 비율이 0.0%로 일치하였고, 5개 시료는 두 방법 모두 100.0%의 저항성 비율을 나타냈다. 나머지 8개 시료에서도 두 방법 간 저항성 비율의 차이는 0.0−5.7%로 낮게 나타났으며, R2 값은 0.9973으로 나타났다(Fig. 5B).
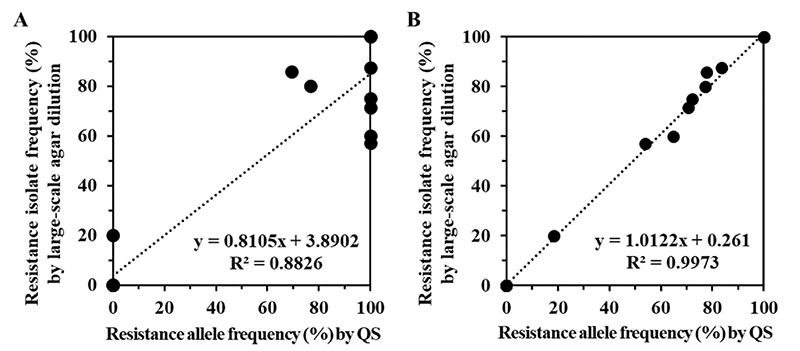
Correlation between actual resistance isolate frequencies and resistance allele frequencies determined by quantitative sequencing (QS) using artificial lesion samples. (A) Conventional QS analysis using gDNA and the Cacytb-P2/Cacytb-R primer set (n=18). (B) Improved QS analysis using cDNA and the RF-CYT1A/RF-CYT2B primer set (n=23). Each symbol represents an individual artificial lesion sample described in Table 2. In panel (A), five samples that failed PCR amplification with conventional primers were excluded from the correlation analysis.
고 찰
QS 분석법은 염기서열 크로마토그램에서 대립유전자의 상대적 피크 높이를 이용하여 집단 내 저항성 비율을 신속하게 추정할 수 있는 방법으로, 병원균 집단 수준의 살균제 저항성 모니터링에 효과적으로 활용되어 왔다(Isa et al., 2026). 본 연구에서도 2023년 포장 집단에서 QS 분석 결과와 대량 한천희석법 결과 간 높은 상관성(R2=0.9424)이 확인되어, 기존 QS 분석법이 포장 집단의 QoI 저항성 비율을 신속하게 추정하는 데 유용함을 확인할 수 있었다. 그러나 2022년 (R2=0.8068)과 2024년(R2=0.8438)에는 두 분석 결과 간의 상관성이 감소하였으며, 특히 2024년에는 C. gloeosporioides species complex에 속하는 종이 분리된 포장에서 두 분석법 간 차이가 크게 나타났다. 이는 최근 국내 고추탄저병균 집단에서 우점종인 C. scovillei 외에도 C. fructicola, C. aenigma, C. gloeosporioides와 같은 다양한 Colletotrichum 종의 분리 비율이 증가하기 때문이라고 판단된다(Shin et al., 2025; An and Kim, 2026).
R2 값의 감소는 기존 QS 분석법에 사용된 Cacytb-P2/Cacytb-R 프라이머가 C. truncatum과 C. acutatum species complex에 속하는 종에서는 cytb 유전자를 안정적으로 증폭하였으나, C. gloeosporioides species complex에 속하는 종에서는 증폭산물을 생성하지 못하였기 때문으로 판단된다. Cytochrome b 유전자는 진균 종에 따라 다양한 위치에 인트론을 포함하고 있으며, 이러한 인트론 구조의 다양성은 PCR 증폭과 QoI 저항성과 관련된 돌연변이의 검출에 영향을 미칠 수 있는 것으로 보고되었다(Abdulkareem et al., 2024; Isa and Kim, 2022; Jiang et al., 2009; Yin et al., 2012). 본 연구에서도 gDNA를 주형으로 사용하였을 때 C. fructicola, C. aenigma, C. gloeosporioides 균주에서 cytb 유전자의 증폭이 이루어지지 않았으며, 이로 인해 실제 포장 집단의 저항성 비율과 QS 분석 결과 간의 불일치가 발생하였다.
2024년의 익산 포장에서는 C. fructicola, C. aenigma, C. gloeosporioides의 분리 비율이 각각 60.0, 10.0, 10.0%로 나타났으며, 기존 QS 분석법과 대량 한천희석법 간 60.0%의 차이가 확인되었다. 반면 완주 포장에서는 C. fructicola의 분리 비율이 70.0%로 높게 나타났음에도 불구하고 두 분석법 간의 차이는 0.0%로 나타났다. 이는 완주 포장에서 분리된 C. nymphaeae, C. fioriniae, C. fructicola 균주가 모두 pyraclostrobin 감수성으로 확인되었기 때문으로 생각된다. 따라서 C. fructicola의 증폭 여부와 관계없이 두 분석법 모두에서 저항성 비율이 0.0%로 나타난 것으로 판단된다.
Jiang 등(2009)은 Botrytis cinerea의 cytb 유전자에서 143번째 코돈 인근에 존재하는 group I intron이 G143A 변이 검출과 PCR 증폭 효율에 영향을 미친다고 보고하였으며, Yin 등(2012)은 동일 종 내에서도 인트론의 위치와 수가 다양함을 확인하였다. 또한 Weir 등(2012)은 C. gloeosporioides species complex가 유전적 다양성이 큰 종 복합체임을 보고하였다. 따라서 본 연구에서 관찰된 증폭 실패 역시 C. gloeosporioides species complex의 cytb 유전자 구조적 다양성과 관련이 있는 것으로 판단된다.
분석 주형을 gDNA에서 cDNA로 교체함으로써 인트론의 영향을 제거할 수 있었으나, 기존 Cacytb-P2/Cacytb-R 프라이머는 일부 균주에서 이중 밴드가 형성되거나 증폭이 불안정하게 나타났다. 반면 RF-CYT1A/RF-CYT2B 프라이머와 cDNA를 함께 사용하였을 때에는 모든 Colletotrichum 종에서 325 bp 크기의 cytb 유전자 증폭산물이 안정적으로 확인되었다. Abdulkareem 등(2024)은 사과 탄저병균을 대상으로 RF-CYT1A/RF-CYT2B 프라이머를 이용하여 다양한 Colletotrichum 종에서 cytb 유전자를 효과적으로 증폭할 수 있음을 보고한 바 있으며, 본 연구 결과는 RF-CYT1A/RF-CYT2B 프라이머가 국내 고추탄저병균 집단에서도 효과적으로 적용될 수 있음을 시사한다.
인공 병반 시료를 이용한 비교 실험에서도 기존 QS 분석법은 최대 30.3%의 오차를 나타내었으며, C. gloeosporioides species complex에 속하는 종만 존재하는 시료에서는 저항성 대립유전자 빈도를 산출할 수 없었다. 반면 cDNA와 RF-CYT1A/RF-CYT2B 프라이머를 이용한 개선된 QS 분석법은 최대 오차가 5.7%에 불과하였으며, 실제 저항성 비율과 높은 선형 관계(R2=0.9973)를 나타냈다. 이러한 결과는 개선된 QS 분석법이 다양한 Colletotrichum 종이 혼재하는 포장 집단에서도 QoI 저항성 비율을 정확하게 추정할 수 있음을 시사한다.
개선된 QS 분석법은 분석 주형으로 cDNA를 사용하기 때문에 total RNA 추출과 역전사 과정을 거쳐야 한다. 따라서 시료의 보관 조건과 RNA의 품질이 분석 결과에 영향을 미칠 수 있다는 한계가 있다. 그러나 본 연구에서 사용한 방법은 다양한 Colletotrichum 종에서 안정적인 cytb 유전자 증폭과 높은 재현성을 나타내어, 종 다양성이 높은 실제 포장 집단의 QoI 저항성 빈도를 정확하게 평가하는 데 유용하게 활용될 수 있을 것으로 판단된다.
최근 기후변화와 살균제 사용에 따른 선택압의 변화로 국내 고추탄저병균 집단의 종 다양성이 증가하고 있으며, 이에 따라 단일 종을 기준으로 개발된 저항성 진단 체계의 한계가 점차 뚜렷해지고 있다. 따라서 병원균 집단의 종 구성 변화를 반영할 수 있는 진단 체계의 구축이 필요하며, 본 연구에서 제시한 cDNA 기반 QS 분석법은 다양한 Colletotrichum 종이 공존하는 실제 포장 조건에서 QoI 저항성 모니터링의 정확성과 재현성을 향상시킬 수 있는 효과적인 방법으로 활용될 수 있을 것으로 판단된다.
Acknowledgments
본 연구는 한국식품농림기술기획평가원(IPET)의 지원을 받아 농림축산식품부(MAFRA)의 작물 바이러스 및 병해충 대응 산업기술개발사업(과제번호 RS-2020-IP320042)을 통해 수행되었습니다.
이해상충관계
저자는 이해상충관계가 없음을 선언합니다.
References
-
Abdulkareem A, Nam MH, Park S, Nam YJ, Kim, HT, 2024. High Quinone Outside Inhibitor (QoI) resistance risk in Colletotrichum species causing strawberry crown rot in Korea. Res. Plant Dis. 30(4):372-380.
[https://doi.org/10.5423/RPD.2024.30.4.372]

-
An S, Kim HT, 2026. Shifting Populations and Increasing Diversity of Colletotrichum Species Causing Pepper Anthracnose Under Rising Temperatures and Fungicide Selection Pressure. Plant Pathol. J.
[https://doi.org/10.5423/PPJ.OA.04.2026.0062]
-
Ali A, Bordoh PK, Singh A, Siddiqui Y, Droby S, 2016. Post-harvest development of anthracnose in pepper (Capsicum spp): Etiology and management strategies. Crop Prot. 90(2):132-141.
[https://doi.org/10.1016/j.cropro.2016.07.026]
-
Bartlett DW, Clough JM, Godwin JR, Hall AA, Hamer M, et al., 2002. The strobilurin fungicides. Pest Manag. Sci. 58(7):649-662.
[https://doi.org/10.1002/ps.520]
- Begum S, Devi N, Marak T, Nath P, Saha J, 2015. In vitro efficacy of some commercial fungicides against Colletotrichum capsici, the causal agent of anthracnose of chilli. Environ. Ecol. 33(4B):1863-1866.
-
Cao P, Wang QJ, Zhu XT, Zhou H, Li R, Wang WP, 2011. Quantitative determination of allele frequency in pooled DNA by using sequencing method. J. Chromatogr. B 879(7-8):527-532.
[https://doi.org/10.1016/j.jchromb.2011.01.014]
-
Chatzidimopoulos M, Ganopoulos I, Vellios E, Madesis P, Tsaftaris A, et al., 2014. Development of a two-step high-resolution melting (HRM) analysis for screening sequence variants associated with resistance to the QoIs, benzimidazoles and dicarboximides in airborne inoculum of Botrytis cinerea. FEMS Microbiol. Lett. 360(2):126-131.
[https://doi.org/10.1111/1574-6968.12594]
-
Corkley I, Fraaije B, Hawkins N, 2022. Fungicide resistance management: Maximizing the effective life of plant protection products. Plant Pathol. 71(1):150-169.
[https://doi.org/10.1111/ppa.13467]
-
Dean R, Van Kan JAL, Pretorius ZA, Hammond-Kosack KE, Di Pietro A, et al., 2012. The Top 10 fungal pathogens in molecular plant pathology. Mol. Plant Pathol. 13(4):414-430.
[https://doi.org/10.1111/j.1364-3703.2011.00783.x]
-
Dorigan, AF, Moreira SI, da Silva Costa Guimarães S, Cruz-Magalhães V, Alves E, 2023. Target and non-target site mechanisms of fungicide resistance and their implications for the management of crop pathogens. Pest Manag. Sci. 79(12):4731-4753.
[https://doi.org/10.1002/ps.7726]
-
Fernández-Ortuño, D, Grabke A., Bryson PK., Amiri A, Peres NA, et al., 2014. Fungicide resistance profiles in Botrytis cinerea from strawberry fields of seven southern US states. Plant Dis. 98(6):825-833.
[https://doi.org/10.1094/PDIS-09-13-0970-RE]
-
Forcelini, BB, Lee S, Oliveira MS, Peres NA, 2018. Development of high-throughput SNP genotyping assays for rapid detection of strawberry Colletotrichum species and the G143A mutation. Phytopathology 108(12):1501-1508.
[https://doi.org/10.1094/PHYTO-04-18-0128-R]
-
Gisi U, Sierotzki H, Cook A, McCaffery A, 2002. Mechanisms influencing the evolution of resistance to Qo inhibitor fungicides. Pest Manag. Sci. 58(9):859-867.
[https://doi.org/10.1002/ps.565]
-
Gisi U, Sierotzki H, 2008. Fungicide modes of action and resistance in downy mildews. pp. 157-167. In: Lebeda A, Spencer-Phillips PT, Cooke, BM (Eds.). The Downy Mildews - Genetics, Molecular Biology and Control. Springer, Dordrecht, Netherlands.
[https://doi.org/10.1007/978-1-4020-8973-2_12]
-
Hong S, Kim S, 2013. The analysis on the production and consumption of red pepper in Korea. Korean J. Agric. Sci. 40(4):405-410.
[https://doi.org/10.7744/cnujas.2013.40.4.405]
-
Isa DA, An S, Kim HT, 2026. Quantitative sequencing as a high-throughput tool for monitoring QoI fungicide resistance in Colletotrichum scovillei causing pepper anthracnose. Plant Pathol. J. 42(1):61-68.
[https://doi.org/10.5423/PPJ.OA.09.2025.0132]
-
Isa DA, Kim HT, 2022. Cytochrome b gene-based assay for monitoring the resistance of Colletotrichum spp. to pyraclostrobin. Plant Pathol. J. 38(6):616-628.
[https://doi.org/10.5423/PPJ.OA.06.2022.0081]
-
Ishii H, Yano K, Date H, Furuta A, Sagehashi Y, et al., 2007. Molecular characterization and diagnosis of QoI resistance in cucumber and eggplant fungal pathogens. Phytopathology 97(11):1458-1466.
[https://doi.org/10.1094/PHYTO-97-11-1458]
-
Islam AHMS, Schreinemachers P, Kumar S, 2020. Farmers’ knowledge, perceptions and management of chili pepper anthracnose disease in Bangladesh. Crop Prot.
[https://doi.org/10.1016/j.cropro.2020.105139]
-
Jiang J, Ding L, Michailides TJ, Li H, Ma Z, 2009. Molecular characterization of field azoxystrobin-resistant isolates of Botrytis cinerea. Pestic. Biochem. Physiol. 93(2):72-76.
[https://doi.org/10.1016/j.pestbp.2008.11.004]
-
Kim YH, Lee JH, Lee SH, 2011. Determination of organophosphate and carbamate resistance allele frequency in diamondback moth populations by quantitative sequencing and inhibition tests. J. Asia Pac. Entomol. 14(1):29-33.
[https://doi.org/10.1016/j.aspen.2010.11.007]
- Kwak J, 2016. Detection for strobilurin fungicide resistance in 3 plant pathogens and development of new detection methods. Master Diss., Chungbuk National Univ., Cheongju. Chungbuk. Korea.
-
Kwon DH, Yoon KS, Strycharz JP, Clark JM, Lee SH. 2008. Determination of permethrin resistance allele frequency in human head louse populations by quantitative sequencing. J. Med. Entomol. 45(5):912-920.
[https://doi.org/10.1093/jmedent/45.5.912]
-
Luo Y, Ma Z, Reyes HC, Morgan DP, Michailides TJ, 2007. Using real-time PCR to survey frequency of azoxystrobin-resistant allele G143A in Alternaria populations from almond and pistachio orchards in California. Pestic. Biochem. Physiol. 88(3):328-336.
[https://doi.org/10.1016/j.pestbp.2007.01.009]
-
Saxena A, Raghuwanshi R, Gupta VK, Singh HB, 2016. Chilli anthracnose: the epidemiology and management. Front. Microbiol.
[https://doi.org/10.3389/fmicb.2016.01527]
-
Seong KM, Lee DY, Yoon KS, Kwon DH., Kim HC, et al., 2010. Establishment of quantitative sequencing and filter contact vial bioassay for monitoring pyrethroid resistance in the common bed bug, Cimex lectularius. J. Med. Entomol. 47(4):592-599.
[https://doi.org/10.1093/jmedent/47.4.592]
-
Sierotzki H, 2015. Respiration inhibitors: complex III. pp. 119-143. In: Ishii H, Hollomon DW (Eds.). Fungicide Resistance in Plant Pathogens: Principles and a Guide to Practical Management. Springer, Tokyo, Japan.
[https://doi.org/10.1007/978-4-431-55642-8_9]
-
Shin YU, Hassan O, Chang T, 2025. Characterization and fungicide sensitivity of Colletotrichum spp. from Capsicum peppers in South Korea. Plant Dis. 109(3):542–553.
[https://doi.org/10.1094/PDIS-07-24-1486-SR]
-
Weir BS, Johnston PR, Damm U, 2012. The Colletotrichum gloeosporioides species complex. Stud. Mycol. 73:115-180.
[https://doi.org/10.3114/sim0011]
-
Yin YN, Kim YK, Xiao CL, 2012. Molecular characterization of pyraclostrobin resistance and structural diversity of the cytochrome b gene in Botrytis cinerea from apple. Phytopathology 102(3):315-322.
[https://doi.org/10.1094/PHYTO-08-11-0234]
-
Zakharychev VV. and Kovalenko LV, 1998. Natural compounds of the strobilurin series and their synthetic analogues as cell respiration inhibitors. Russ. Chem. Rev. 67(6):535-552.
[https://doi.org/10.1070/RC1998v067n06ABEH000426]
Sohyeon An, Department of Plant Medicine, College of Agriculture, Life & Environment Sciences, Chungbuk National University, Postdoctoral researcher, https://orcid.org/0000-0003-4450-4094 Participation in the entire experiment, analysis of data for the work, and writing – original draft preparation
Subin Park, Department of Plant Medicine, College of Agriculture, Life & Environment Sciences, Chungbuk National University, Ph.D. student, https://orcid.org/0009-0003-8237-0573 Experimental participation – inoculation of pepper anthracnose pathogens onto pepper fruits, and analysis of data for the work
Suengeun Lee, Department of Plant Medicine, College of Agriculture, Life & Environment Sciences, Chungbuk National University, Ph.D. student, https://orcid.org/0009-0002-4025-637X Experimental participation – performation of PCR and QS, and analysis of data for the work
Heung Tae Kim, Department of Plant Medicine, College of Agriculture, Life & Environment Sciences, Chungbuk National University, Professor, https://orcid.org/0000-0001-7132-0587 Establishment of experimental plan, methodology proposal, and writing original paper and editing