
QuEChERS 전처리와 LC-MS/MS 및 GC-MS/MS를 이용한 Allium 속 작물의 잔류농약 분석에서 매질효과 저감
 ; Ji Won Lee†
; Min-seok Oh
; Hyun Ho Noh
; Jeong Yoon Choi
; Haeri Han
; Sung Eun Park
; Sun Young Lee
초록
Allium 속 작물은 다량의 간섭물질로 인해 잔류농약 분석이 어려운 작물로 알려져 있다. 본 연구에서는 QuEChERS 전처리와 LC-MS/MS 및 GC-MS/MS를 활용하여 Allium 속 작물의 효율적인 잔류농약 분석 방법을 찾고자 하였다. 마늘과 양파를 대상으로 액화질소(LN2)를 이용하여 급속 냉동 후 분쇄, -20oC에서 서서히 냉동한 후 드라이아이스를 첨가하면서 분쇄, 상온에서 분쇄하는 방법을 비교하고자 152개 농약성분에 대한 매질효과를 측정하였다. 또한 추출용매 첨가 전 방치 시간, PSA 첨가량 및 추출액의 freezing-out에 따른 매질효과의 영향도 측정하였다. 그 결과, 마늘과 양파의 분쇄 및 추출 조건별 매질효과는 두 작물에서 모두 상온 > LN2 > 드라이아이스 순으로 높았다. 또한 정제 과정에서 PSA 정제 후 freezing-out, PSA 정제 없이 freezing-out 및 PSA 두 배량 첨가는 유럽 공인 QuEChERS법의 PSA 표준량 처리와 비교하여 매질효과 저감 효과가 유사하거나 낮았다. 따라서 -20oC에서 서서히 냉동한 후 드라이아이스를 첨가하면서 분쇄하고, 냉동 상태를 유지하며 칭량한 후 바로 추출용매를 첨가하는 방법이 마늘과 양파의 잔류농약 분석에서 매질효과를 효과적으로 줄일 수 있는 것으로 판단된다.
Abstract
Due to the presence of numerous interfering substances, Allium crops are known to be challenging matrices for pesticide residue analysis. In our study, we investigated an efficient method for pesticide residue analysis in Allium crops using QuEChERS sample preparation coupled with Liquid Chromatography-Tandem Mass Spectrometry (LC-MS/MS) and Gas Chromatography Tandem Mass Spectrometry (GC-MS/MS). We evaluated a total of 152 pesticide compounds in onion and garlic, and compared three different comminution procedures: rapid freezing with liquid nitrogen (LN2), followed by grinding; gradual freezing at -20°C, followed by grinding with the addition of dry ice; and grinding at room temperature. We also evaluated the effects of standing time before adding the extraction solvent, the amount of PSA, and freezing-out of the extracts on matrix effects. The results showed that the matrix effects under different comminution and extraction conditions in both onion and garlic were the highest in the following order: room temperature > LN2 > dry ice. We noted that PSA treatment followed by freezing-out, freezing-out without PSA treatment, and treatment with twice the standard amount of PSA demonstrated similar or lower reduced matrix-effects than that observed in the treatment with the standard amount of PSA specified in the European standard QuEChERS method (EN 15662). In conclusion, to reduce matrix effects in the pesticide residue analysis of onion and garlic, an effective approach is to gradually the sample freeze at -20°C, followed by grinding with the addition of dry ice; maintain the frozen state during weighing; and immediately add the extraction solvent.
Keywords:
Allium crop, dry ice, liquid nitrogen, matrix effect, pesticide residue analysis키워드:
Allium 속 작물, 드라이아이스, 매질효과, 액화질소, 잔류농약분석서 론
농식품 중 잔류농약 분석은 다양한 시료에 존재하는 극미량의 성분을 분석해야 하므로 농약 성분 이외의 불순물을 제거해야 하는 복잡한 전처리 과정이 필요하며 숙련된 분석자와 최적의 실험실 환경하에서 재현성 있는 분석 결과 값을 얻을 수 있다(European Commission, 2026).
잔류농약 분석에서 매질효과의 발생을 줄이기 위한 근본적인 방법은 정제과정에서 불순물을 최대한 제거하는 것이다. 그러나 시료 자체의 매트릭스가 매우 복잡한 농산물은 정제과정을 거쳐도 최종 추출액에 여전히 많은 불순물을 함유한다. 마늘, 양파 등의 Allium 속 작물은 그러한 대표적인 예이다. Allium 속 작물은 유기황을 포함하는 화합물인 alliin을 포함하고 있고 자르거나 분쇄 등의 과정에서 alliinase 효소의 작용에 의해 alliin이 allicin으로 바뀌는데 allicin은 안정한 화합물이 아니기 때문에 신속하게 다양한 allyl sulfides류의 화합물을 형성하면서 분해된다(Wang et al., 1998). 이러한 화합물들은 중간극성에서 비극성의 성질을 갖고 있어(Iitsuka et al., 2010), 비극성 농약과 유사하게 행동하기 때문에 정제 과정에서 이러한 화합물들을 잘 제거하는 것은 쉽지 않고 Allium 속 작물의 잔류농약 분석에서 매질효과를 매우 크게 만드는 요인으로 작용한다. 따라서 Allium 속 작물의 전처리 과정 중 alliinase를 불활성화시켜 sulfides류의 화합물의 생성을 억제시키는 방법이 필요하다. 이러한 전처리 과정의 개발을 통해 매질효과는 줄어들 수 있다.
마늘, 부추, 파등의 Allium 속 작물은 자르거나 분쇄 등의 과정으로부터 생성되는 allyl sulfides류의 화합물 때문에(Wang et al., 1998), 분석이 매우 어려운 농산물로 꼽힌다. Allyl sulfides류의 생성에 관여하는 alliinase 효소의 활성은 온도 및 pH에 따라 달라진다(Kuettner et al., 2002; Tobkin and Mazelis 1979; Yoo and Pike 2001), 잔류농약 분석에서 alliinase 효소의 활성을 억제하기 위해 강산을 첨가해서 분석하거나 열을 가하는 방법(Zhang et al., 2008)은 농약의 분해를 초래할 가능성이 있어 모든 농약의 분석에 적용하기는 어렵다. Li et al.(2022)은 양파와 마늘을 전자렌지로 가열 후 매질효과는 줄었으나 procymidone의 잔류량도 감소하였다고 보고하였다. Alliinase의 활성은 온도를 낮춤으로써도 억제된다고 보고되었다(Schwimmer and Mazelis 1963; Urs et al., 1994). Choi et al. (2025)은 양파, 대파, 마늘의 상온 시료에 드라이아이스를 첨가하여 분쇄한 처리와 초저온(-70oC) 냉동 후 분쇄한 처리가 상온 시료를 그대로 분쇄한 처리보다 LC-MS/MS에서 농약의 매질효과를 저감시켰다고 보고한 바 있다. 한편 현재 다수 실험실에서 활용되는 QuEChERS법(Anastassiades et al., 2003a; Lehotay et al., 2007)은 10 g 정도의 시료를 진탕기로 추출하는 방법으로써, 대표성 있는 시료 확보와 추출 효율 증대를 위해 냉동 상태를 유지하며 분쇄하도록 하고 있다(European committee for standardization, 2018; Lehotay and Cook 2015).
따라서 본 연구에서는 QuEChERS 전처리와 LC-MS/MS 및 GC-MS/MS 활용 잔류농약 분석에서 Allium 속 작물의 효율적인 분석 방법을 찾고자, 마늘과 양파를 대상으로 액화질소(LN2)로 급속 냉동하여 분쇄하는 방법과 -20oC에서 서서히 냉동하고 드라이아이스를 추가하며 분쇄하는 방법을 상온에서 분쇄하는 방법과 비교하였으며, 추출 용매 첨가 전 방치 시간, PSA 첨가량, freezing-out에 따른 매질효과의 영향을 측정하였다.
재료 및 방법
시약 및 기구
시험에 사용된 152 농약 성분과 IS 1종은 Dr. Ehrenstorfer GmbH(Augsburg, 독일), Sigma Aldrich(Steinheim, 독일), Riedel-del Haen(Seelze, 독일), LGC Standards GmbH(Wesel, 독일)로부터 구입하여 사용하였다. Stock solution은 1 mg/mL의 농도 수준으로 acetonitrile로 제조하였고 pH에 민감한 농약은 0.4% acetic acid를 함유한 acetonitrile로 제조하였다. Working standard mixture은 각 기기분석 그룹별로 1 µg/mL의 농도수준으로 acetonitrile 또는 0.4% acetic acid함유 acetonitrile로 희석하여 제조하였고 일주일 안에 전처리 실험에 사용하였다. IS는 GC-MS/MS와 LC-MS/MS를 위해 20 µg/mL의 chlorpyrifos d10(diethyl d10)을 사용하였으며 시료와 표준용액에 첨가할 때는 acetonitrile로 10배 희석하여 사용하였다. Analyte protectants(APs)(Anastassiades et al., 2003b)로써 ethyl glycerol, sorbitol, δ-gluconolacton, shikimic acid는 Sigma-Aldrich 제품을 사용하였다. APs의 제조는 acetonitrile과 water를 혼합하여 sorbitol 50 mg/mL(50% water), δ-gluconolacton 50 mg/mL(40% water), shikimic acid 50 mg/mL(30% water)을 만든 후 acetonitile로 희석하여 200 mg/mL ethyl glycerol, 5 mg/mL sorbitol, 10 mg/mL δ-gluconolacton, 5 mg/mL shikimic acid가 되도록 조제하였다(Payá et al., 2007). 초순수는 Direct-Q 3 UV Ultrapure Water Purifcation System (EMD Millipore Corp., Billerica, MA)를 사용하여 제조하였고 acetonitrile과 methanol(HPLC급), acetic acid(96%), formic acid(98–100%)는 Merck(Darmstadt, 독일) 제품을 사용하였다. 5% formic acid 용액은 acetonitrile로 제조하였다. 추출을 위해 UCT(Levittown, 미국)사의 QuEChERS 팩(4 g anh. MgSO4+1 g sodium chloride(NaCl)+1 g trisodium citrate dihydrate(Na3Cit·2H2O) + 0.5 g disodium hydrogencitrate sesquihydrate(Na2HCit·1.5H2O))을 이용하였다. 정제단계의 d-SPE를 위해 anh. MgSO4 grit는 Sigma-Aldrich(Steinheim, 독일)사로부터 구입하였으며 PSA 흡착제는 Varian(Palo Alto, 캐나다)사의 Bondesil-PSA(40 µm)을 사용하였다. 시료 분쇄는 Prime Cut UM5(Stephan Machinery GmbH, Hameln, 독일), 시료의 추출은 Geno Grinder 2010(SPEX Sample Prep, Metuchen, NJ), 원심분리는 Rotanta 460(Hettich Tuttlingen, 독일)을 사용하였다.
시료 분쇄
실험에 사용된 마늘, 양파는 유기농산물 마트에서 구입하였다. 마늘과 양파의 분쇄 처리 과정은 Fig. 1에 나타내었다. 마늘은 전체를 감싸고 있는 가장 바깥쪽의 껍질과 대만 제거하였고 양파는 말라서 쉽게 떨어지는 바깥쪽의 껍질만 제거한 후 시험에 사용하였다. LN2를 이용한 급속 냉동 처리의 경우 스티로폼 용기를 준비하여 절단되지 않은 마늘과 양파를 각각 넣고 LN2를 부어 20분 방치하여 완전히 얼린 후 곧바로 분쇄기(Prime Cut UM5)로 분쇄하였는데, 분쇄 동안 냉동 상태가 잘 유지되었다. Dry ice 처리구의 경우 양파는 2−4등분하고 마늘은 절단없이 그대로 -20oC 냉동고에서 하룻밤 동안 얼린 후에 냉동 상태의 유지를 위해 dry ice를 첨가하면서 분쇄하였다. 냉동 분쇄의 경우 분쇄 과정에서 분쇄기 뚜껑과 본체의 접촉 부위의 시료들은 제외하고 냉동 상태가 잘 유지된 시료만을 취하였으며 칭량 과정에서도 시료가 상온이 되지 않도록 스티로폼통에 보관하면서 신속히 무게를 칭량하고 곧바로 추출 용매를 추가하였다. 상온 분쇄의 경우 마늘은 그대로 분쇄하고 양파의 경우 2−4등분하여 분쇄하였다. 상온에서 분쇄된 시료는 곧바로 무게를 칭량하고 상온에서 120분간 방치하고 추출용 용매를 첨가한 처리구(RT-120)와 상온에서 15분간 방치하고 추출용 용매를 첨가한 처리구(RT-15)로 나누어 분석을 시작하였다.
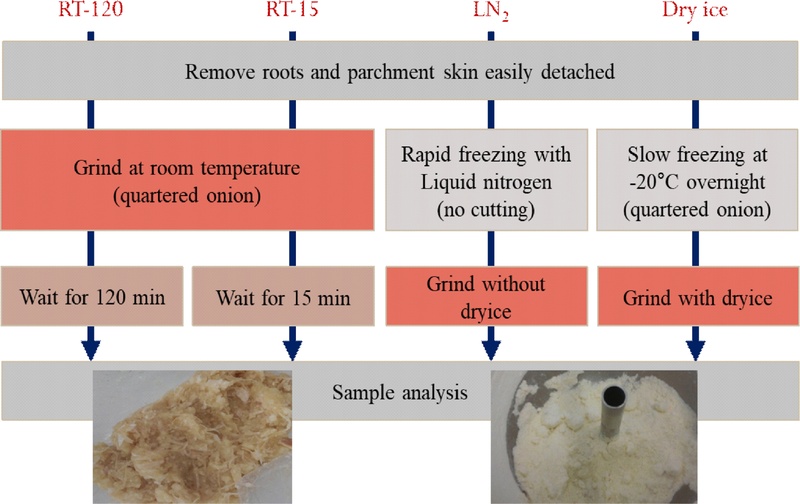
Methods for grinding of onion and garlic at different temperatures.
전처리
시료의 전처리는 citrate buffer를 이용하는 QuEChERS법(Hepperle et al., 2015; Payá et al., 2007)을 이용하였는데 마늘의 경우 수분함량이 약 60% 정도이므로 수분을 보충하기 위해 물을 추가하여 추출하였다(European committee for standardization, 2018). 정제 처리를 다양화하기 위해 일부 추출액은 유럽 공인 QuEChERS법(EN 15662) PSA 표준량의 두 배량 처리, PSA 정제 후 freezing-out, 정제 없이 freezing-out 처리를 별도로 수행하였다. 추출 및 정제 과정에 의한 영향을 배제하고 최종 추출액의 매질효과에 미치는 영향을 측정하기 위해 표준용액은 전처리 과정을 마친 후에 첨가하였는데 분석법의 절차는 다음과 같았으며 Fig. 2에 나타내었다. ① 양파의 경우 10.0 ± 0.1 g, 마늘의 경우 5.0 ± 0.1 g의 시료를 50 mL 튜브에 칭량하고 마늘에는 6 mL의 물을 첨가한다. ② 10 mL의 acetonitrile을 튜브에 첨가한 후 15분간 추출기로 격렬히 흔든다. ③ 4 g anh. MgSO4, 1 g NaCl, 1 g Na3Cit·2H2O, 0.5 g Na2HCit·1.5H2O을 첨가한다. ④ 뚜껑을 막고 추출기로 1분간 격렬히 진탕한 후 3450 rcf에서 5분간 원심분리한다. ⑤ 6 mL의 추출물을 a) 150 mg PSA와 900 mg anh. MgSO4, b) 300 mg PSA + 1.8 g MgSO4(양파와 마늘 RT-120, 마늘 LN2 처리구만 해당), c) 150 mg PSA + 900 mg anh. MgSO4(양파와 마늘 RT-120, 마늘 RT-15와 LN2 처리구만 해당), d) 정제시약 무첨가(양파 RT-120 처리구만 해당)의 각 튜브에 추가한다. ⑥ a), b) c) 튜브는 뚜껑을 닫고 30초간 진탕한 후 3450 rcf에서 5분간 원심분리하고 c), d) 튜브는 freezing-out을 위해 -20oC에서 하룻밤 보관한 후 깔때기에 cotton wool을 넣고 여과하였다. ⑦ 4 mL의 상등액을 유리 용기에 옮기고 40 µL의 5% formic acid 함유 acetonitrile을 첨가한다. ⑧ LC-MS/MS 분석을 위해 800 µL의 추출액을 vial에 옮기고 최종 용액의 농도가 0.1 µg/mL가 되도록 100 µL의 혼합 표준용액과 100 µL의 IS 용액을 첨가하고 GC-MS/MS 분석을 위해 LC-MS/MS 분석과 동일하게 제조 후 10 µL의 APs 용액을 첨가한다. Solvent standard 용액에는 추출액 대신 800 µL의 acetonitrile을 추가한다. 다양한 처리와 농약 성분 수로 인하여 처리구별로 1 반복만 수행하였으나, 공추출물 무게 측정, GC-MS/MS의 Total ion chromatogram(TIC) 비교 등을 추가하여 처리구별 매질효과의 근거 자료를 뒷받침하였다.
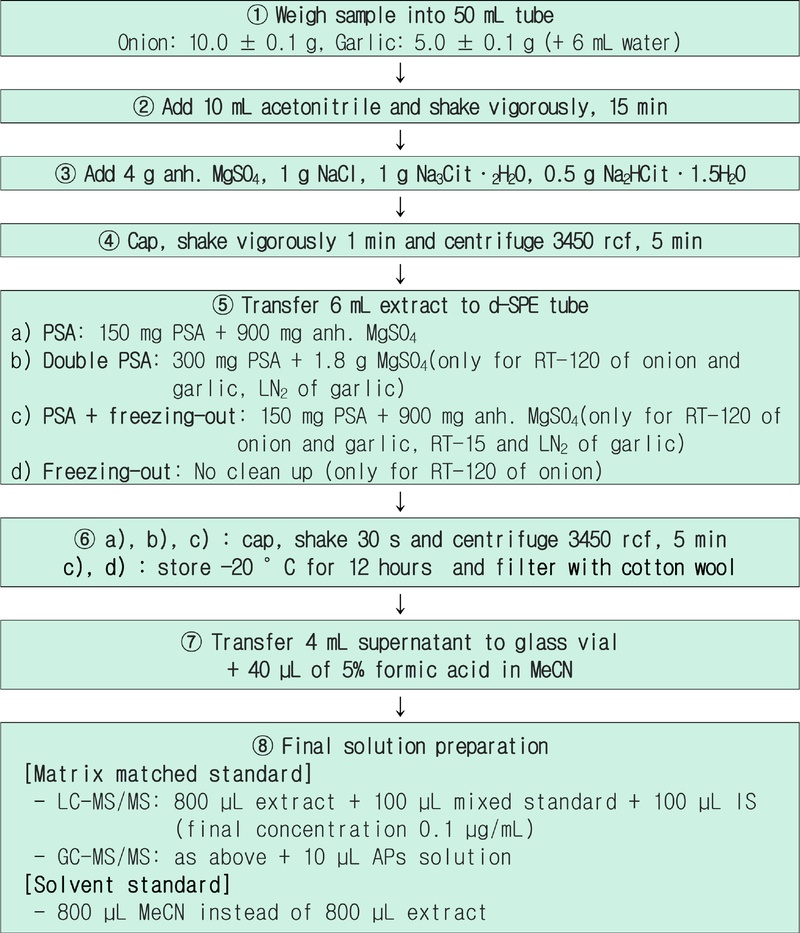
Sample Preparation for Pesticide Residue Analysis in Onion and Garlic Using QuEChERS Extraction.
각 농산물별 흡착제의 매질효과의 계산은 matrix와 solvent의 peak area를 이용하여 아래의 식과 같이 계산되었다.
공추출물의 무게 측정
처리구별 정제 효과를 측정하기 위해 추출액에 잔존하는 공추출물의 무게를 측정하였다. 무게는 소수점 넷째 자리까지 측정하였으며 반복 측정을 하여 무게의 변화가 없는 시점부터의 최종 2 반복을 평균하여 사용하였다. 공추출물 무게 측정 방법은 위 전처리 과정의 ⑥의 단계를 마친 5 mL의 추출액을 10 mL의 투명 유리 용기에 각각 담고 질소가스로 서서히 용매를 제거한 후 무게를 측정하고 미리 측정해 둔 유리 용기의 무게를 제외하여 공추출물의 무게를 산출하였다.
기기분석조건
LC-MS/MS는 AQUITY ultra-performance LC(UPLC)(Waters Corp. Milford, MA)가 연결된 5500 Qtrap(ABSCIEX, Darmstadt, 독일)을 사용하였으며 분석 컬럼은 Waters사의 AQUITY UPLC bridged ethylene hybrid(BEH)(2.1 × 200 mm, 1.7 µm particle size) C18 column을 Van Guard BEH(2.1 × 5 mm, 1.7 µm particle size) C18 precolumn과 연결하여 사용하였으며 시료주입량은 2 µL였고 컬럼온도는 40oC, 유속은 0.4 mL/min이었다. 이동상은 A로써 5 mM ammonium formate과 5% methanol을 함유한 초순수를 사용하였고 이동상 B로써 5 mM ammonium formate 함유 methanol을 사용하였다. 분석은 분석법 1과 2로 나누어 진행하였는데 분석법 1(Table 1)은 이동상 A를 60%로 흘리기 시작하여 10분 동안 10%로 바꾸고 13분까지 유지하고 13.1분까지 60%로 바꾼 후 19분까지 유지하였다. 분석법 2(Table 2)는 이동상 A를 100%로 흘리기 시작하여 0.5분까지 60%, 7.5분까지 10%로 바꾼 후 11분까지 유지하고 11.1분까지 100%로 바꿔 14분까지 유지하였다. 두 방법 모두 positive mode에서 ion spray voltage 5500 V, nebulizer gas 60 psi, turbo gas 50 psi, curtain gas 30 psi, source temperature 470oC로 분석하였다. 데이터 처리는 Analyst Software 1.6.2(ABSCIEX)를 사용하였다.

Retention times and selected reaction monitoring (SRM) pairs in LC-MS/MS ESI(+) method 1
Retention times and selected reaction monitoring (SRM) pairs in LC-MS/MS ESI(+) method 2
GC-MS/MS 분석(Table 3)은 Thermo Scientific Trace 1310 GC system(Waltham, 미국)과 연결된 Thermo Scientific TSQ 8000(Thermo Scientific, Waltham, 미국)이 EI mode에서 사용되었다. 시료는 TriPlus RSH autosampler(Thermo Scientific, Waltham, 미국)를 사용하여 3 µL를 주입하였다. PTV는 시료 주입 후 0.8분 동안 50oC로 유지하고 이 시간 동안 open purge valve에서 20 mL/min의 vent flow를 유지함으로써 solvent vent를 진행했다. 이후 purge valve를 닫은 후에 PTV 온도는 초당 12oC로 300oC까지 승온하여 10분간 유지하고 다시 240oC로 낮추어 1분간 유지하였다. 컬럼은 Thermo Scientific TG-5Sil MS(30 m × 0.25 mm, film thickness 0.25 µm)를 사용하였고 유속은 2 mL/min로 일정하게 유지하였다. GC 오븐 온도는 40oC에서 2분간 유지하고 220oC까지 30oC/min로 승온하고 260oC까지 5oC/min로 승온하였으며 280oC까지 20oC/min로 승온한 후 15분간 유지하였다. MS/MS 조건은 selected reaction monitoring(SRM) 모드를 이용하였고 이온화 에너지는 70 eV였고 ion source 온도는 280oC, transfer line은 280oC였다. 데이터 처리는 Xcalibur 4.0을 이용하였다.
Retention times and selected reaction monitoring (SRM) pairs in GC-MS/MS
결과 및 고찰
양파
양파의 분쇄 조건과 흡착제 처리에 따른 추출액에 잔존하는 공추출물의 무게를 Table 4에 나타냈다. 양파의 분쇄 처리 조건별 시료 1 g당 공추출물의 무게는 정제 처리를 하지 않은 raw 추출물의 경우 상온 분쇄하여 120분 후 용매 첨가구(RT-120)에서 2.9 mg, 상온 분쇄 15분 후 추출 처리구(RT-15)에서 2.8 mg, LN2 급속 냉동 후 분쇄 처리구(LN2)에서 2.7 mg, -20oC에서 서서히 냉동 후 분쇄시 dry ice 첨가 처리구(Dry ice)에서 2.5 mg으로 상온에 비해 냉동 처리구가 약간 적었다. PSA 정체 처리시 0.8 mg으로 약 30%만 잔존하여 공추출물의 무게는 효과적으로 줄어들었으며, 추출액을 PSA 정제 없이 -20oC에서 하룻밤 냉동 보관한 처리(Freezing-out)는 2.2 mg으로 75% 수준이 잔존하여 불순물 제거 효과가 크지 않았다. PSA 처리 후 -20oC에서 하룻밤 냉동보관한 처리(PSA+Freezing-out)와 PSA 두배량 처리(double PSA)는 PSA 정량처리(PSA)와 차이가 거의 없어 추후 매질효과의 측정은 PSA 정량 처리만을 대상으로 수행하였다.
Amount of remaining co-extractives in onion extracts obtained various grinding and cleanup methods(mg)
농약을 처리하지 않은 양파의 PSA 처리 후 최종 정제액은 전체 분석 시간 32분 중에서 5−24분에서 주로 피크들이 나타났고 가독성을 위해 5−24분 범위의 GC-MS TIC를 Fig. 3에 나타냈다. 전반적인 크로마토그램은 RT-120 > RT-15 > LN2 > Dry ice 순으로 베이스라인이 높고 피크들이 더 컸다. 본 논문에서는 나타내지 않았지만 PSA를 처리하기 전 raw 추출물의 크로마토그램도 동일한 경향이었고 이러한 경향이 PSA 정제 후에도 그대로 나타났다. LN2 처리의 경우 머무름 시간 8.9분에서 보이는 피크처럼 raw 추출물에 비해 훨씬 큰 피크가 가끔씩 나타났다.
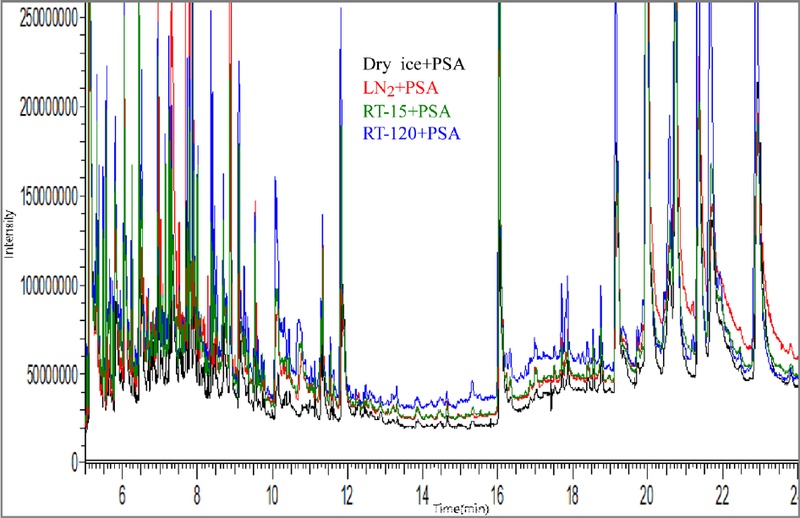
GC-MS total ion chromatograms of final onion extracts from PSA cleanup after different grinding methods.
양파의 분쇄 및 추출 조건별 PSA 처리 후 정제액의 LC-MS/MS에서의 매질효과는 1−5%의 값을 나타낸 fenpropidin 등 15성분, 6-32%의 값을 나타낸 4.4-dichlorobenzophenon 등 4성분을 제외한 대부분의 농약에서 ion suppression에 의한 음의 값을 보였다. 절대값으로 나타낸 매질효과의 범위별 농약 수의 분포 비율을 Fig. 4에 나타냈다. 매질효과는 RT-120 > RT-15 > LN2 > Dry ice 순으로 컸으며 ≤10%의 매질효과를 보인 농약의 수는 RT-120 64%, RT-15 73%, LN2 83%, Dry ice 90%였다. 20%를 초과하는 매질효과를 보인 농약의 수는 RT-120에서 19%, RT-15에서 8%, LN2와 Dry ice에서 1% 미만이었다. 상온에서 분쇄하고 오래 방치할수록 매질효과는 커졌으며 LN2, dry ice 등 냉동 조건하에서의 분쇄는 매질효과를 크게 낮추었다. LC-MS/MS에서 매질효과의 계산에 IS의 적용에 따른 매질효과의 크기는 차이가 없었다.
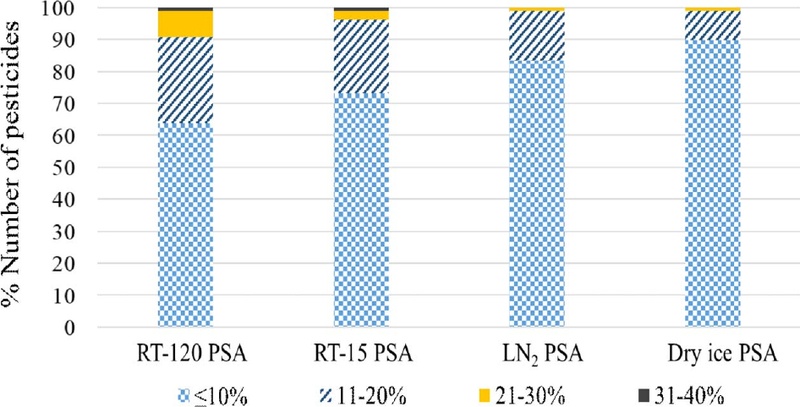
Number of pesticides distributed in each matrix effect range in LC-MS/MS analysis. Internal standards were not used for onion extraction by various grinding methods. Extracts were obtained by the methods using room temperature (RT), liquid nitrogen (LN2) and dry ice.
냉동처리 간에는 LN2 처리구에 비해 Dry ice 처리구에서 매질효과가 약간 더 낮았다. 두 처리를 비교해 보면 LN2 처리구는 식물체를 상온에서 급속히 냉동시킨 후에 분쇄한 것이고 Dry ice 처리구는 -20oC에서 하룻밤 동안 서서히 냉동시킨 후에 분쇄하면서 dry ice를 첨가한 것이다. Urs et al.(1994)은 양파의 alliinase 활성 실험에서 LN2를 첨가해서 급속히 냉동시킬 경우 상온 상태가 되면 다시 효소의 활성이 살아날 수 있다고 보고하였다. 본 실험에서 LN2 처리구보다 Dry ice 처리구가 alliinase 활성을 더 억제하여 매질효과를 약간 더 낮춘 것으로 추정되나, 본 실험에서는 alliinase 활성이나 alliin, allicin 또는 allyl sulfides의 농도를 직접 측정하지 않았으므로 매질효과 감소가 alliinase 활성 억제에 의한 것이라는 결론을 내리기에는 한계가 있다.
GC-MS/MS의 경우 매질효과를 줄이기 위해 기기분석시 APs를 사용하였다(European committee for standardization, 2018). -20oC에서 서서히 냉동 후 dry ice를 첨가하면서 분쇄하고 PSA로 정제한 처리구의 GC-MS/MS에서의 매질효과를 Fig. 5에 나타냈는데, APs를 사용하였음에도 매질효과는 상당히 나타났다. 매질효과는 대부분의 농약이 ion enhancement에 의한 양의 값으로 나타났으며, IS를 적용하는 경우 매질효과의 값은 전체적으로 낮아졌다. 전체 농약에 대한 IS 적용과 미적용에 따른 매질효과의 변화(Fig. 5)와 bifenthrin의 예시를 보면(Fig. 6의 왼쪽), IS를 적용함으로써 매질효과가 잘 보정됨을 알 수 있었다. IS를 사용하여 계산한 각 매질효과 절대값의 범위별 농약의 수를 살펴본 결과(Fig. 6의 오른쪽), LN2 처리구에 비해 Dry ice 처리구가 매질효과가 적었으며 Dry ice 처리 및 PSA 정제 후의 농약 성분의 매질효과의 분포는 ≤10%에 76%, 11−20%에 14%, >21%에 10%로 분포했다.
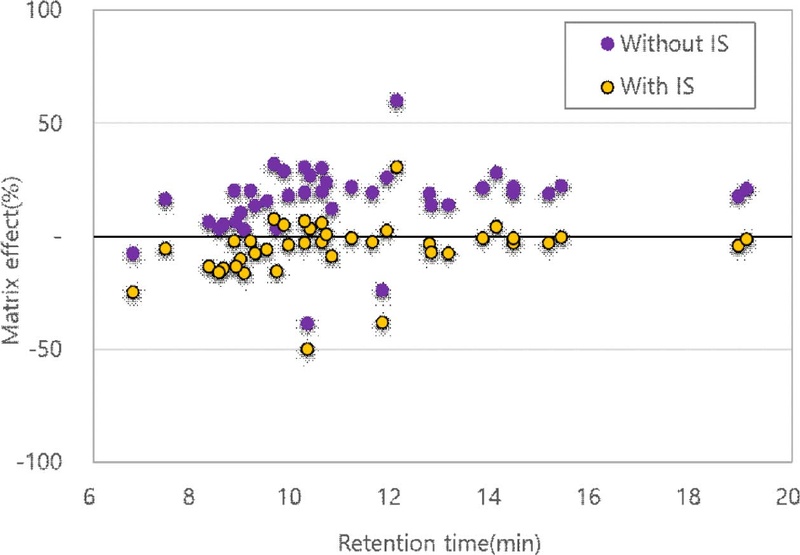
Matrix effect of pesticides in GC-MS/MS with and without peak normalization to internal standard for onion extracts from PSA cleanup after grinding with dry ice.
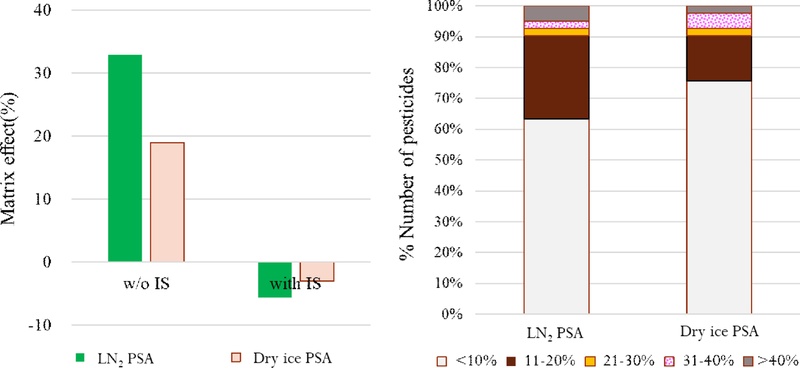
Matrix effect of bifenthrin in GC-MS/MS with and without peak normalization to internal standard (left). Number of pesticides distributed in each matrix effect range in GC-MS/MS analysis with peak normalization to internal standard for onion extracts from grinding with LN2 and dry ice (right).
마늘
마늘의 분쇄 조건과 흡착제 처리에 따른 추출액에 잔존하는 공추출물의 무게를 Table 5에 나타냈다. 마늘은 양파 대비 잔존 불순물 무게가 최대 2배 높은 것으로 확인되었다. 마늘의 분쇄 처리 조건별 시료 1 g당 무게는 정제 처리를 하지 않은 raw 추출물의 경우 RT-120 처리에서 6.1 mg, RT-15 처리에서 6.4 mg, LN2 처리에서 4.5 mg, Dry ice 처리에서 4.7 mg으로 상온 분쇄에 비해 냉동 조건 분쇄가 약 70% 수준으로 잔존하여 공추출물이 적었다. 추가로 PSA 정제 처리시 상온 분쇄에서는 4.6−4.9 mg으로 raw 추출물 대비 71−75% 수준으로 잔존하여 불순물 제거 효과가 크지 않았고, 특히 냉동 분쇄에서는 4.1−4.2 mg으로 raw 추출물 대비 90% 수준으로 잔존하여 PSA 정제 처리에 의한 공추출물의 감소가 거의 없었다. 마늘에서도 PSA 처리 후 -20oC에서 하룻밤 냉동보관한 처리(PSA+Freezing-out)와 PSA 두배량 처리(double PSA)는 PSA 정량 처리(PSA)와 차이가 거의 없었다.
Amount of remaining co-extractives in garlic extracts from different grinding methods and cleanup methods(mg)
농약이 첨가되지 않은 마늘의 각 분쇄 방법별 분쇄 후 PSA 처리한 최종 정제액의 GC-MS TIC의 5.0−9.5분 범위를 Fig. 7에 나타냈다. 마늘의 경우 Y축의 범위가 4.4 × 10⁷을 보여 양파의 Y축 범위인 8.0 × 10⁶보다 훨씬 컸고 머무름 시간 10여분까지 많은 성분들의 피크가 나타났다. 크로마토그램은 RT-120 > LN2 > Dry ice 순으로 베이스라인이 높고 피크가 더 커서 양파와 비슷한 결과를 보였다.
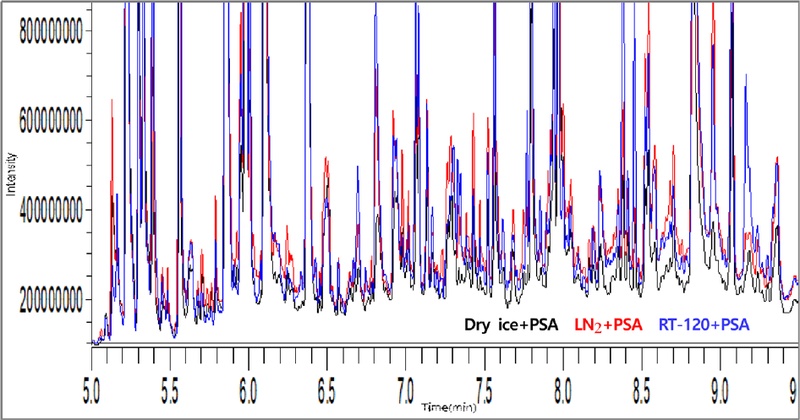
GC-MS total ion chromatogram of garlic final extracts from PSA cleanup after different grinding methods.
마늘의 경우 추출 및 정제 처리 후 측정한 잔존 불순물의 무게(Table 5)에서 LN2와 Dry ice 처리에서는 PSA 처리전 raw 추출물과 PSA 정제 후의 무게가 비슷하였고, Dry ice 처리에서는 raw 추출물과 PSA 처리 후 정제액의 크로마토그램은 차이가 거의 없어(Fig. 8) 추가적인 PSA 정제에 의한 효과가 거의 없는 것으로 판단하였다.
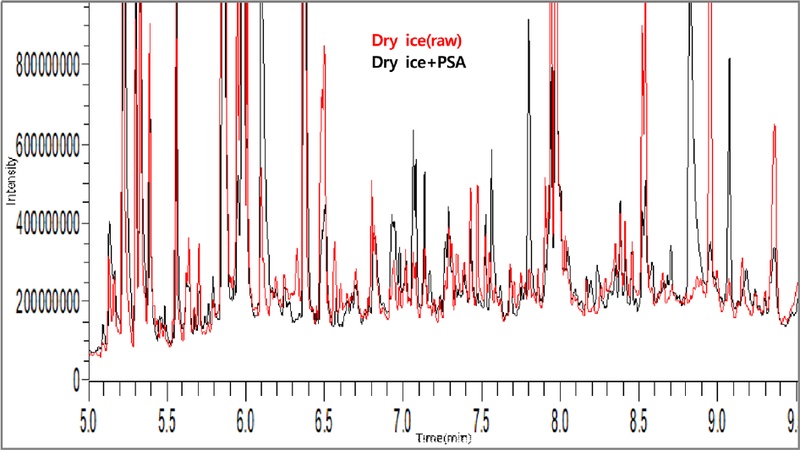
GC-MS total ion chromatograms of garlic raw extract and final extract from PSA cleanup after grinding with dry ice.
따라서 마늘의 분쇄 및 추출 조건별 매질효과의 비교는 Dry ice 처리구의 raw 추출액으로 나타냈다. 매질효과는 3−5%의 값을 나타낸 4.4-Dichlorobenzophenon 등 4성분, 6−24%의 값을 나타낸 Milbemectin A4 등 5성분을 제외한 대부분의 성분에서 ion suppression에 의한 음의 값을 보였다. Dry ice 처리구의 raw 추출물에 대한 매질효과 절대값의 분포 비율을 Fig. 9에 나타냈는데, RT-15의 경우 기기분석 시료 제조상의 오류로 데이터 산출에서 제외하였다. 매질효과는 RT-120 > LN2 > Dry ice 순으로 매질효과가 컸으며 마늘의 경우 양파보다 매질효과가 훨씬 커서 ≤20%의 매질효과를 보인 농약의 수는 RT-120 52%, LN2 54%, Dry ice 60%였다. 40%를 초과하는 매질효과를 보인 농약의 수는 RT-120 20%, LN2 16%, Dry ice 12%였다. 양파와 같이 냉동 조건하의 분쇄가 매질효과를 낮추었고 특히 서서히 냉동시키고 dry ice를 첨가하는 분쇄가 LN2를 사용해서 급속히 냉동시켜 분쇄하는 것보다 매질효과가 약간 적었다.
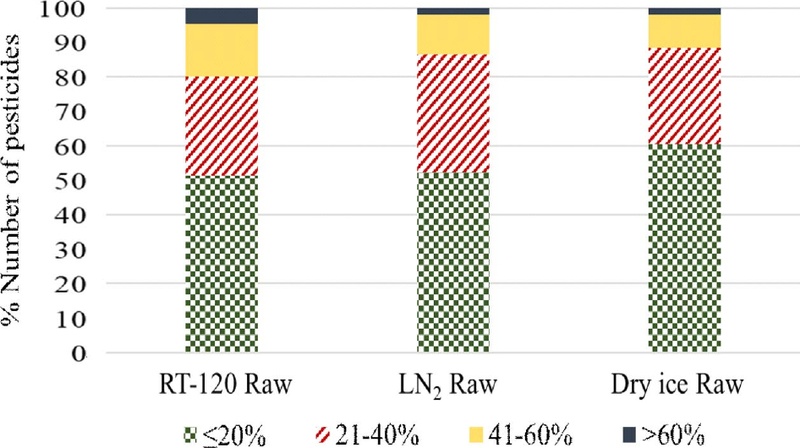
Number of pesticides distributed in each matrix effect range in LC-MS/MS analysis without use of IS for garlic extracts by different grinding methods.
마늘에서도 GC-MS/MS 분석은 APs를 사용하였으며, 양파와 마찬가지로 대부분의 농약이 ion enhancement에 의한 양의 값으로 나타났으며 IS를 적용하는 경우 매질효과의 값은 전체적으로 낮아졌다. Dry ice 처리 raw 추출물에서의 IS 사용에 따른 매질효과의 변화를 permethrin(Fig. 10의 왼쪽)과, 전체 농약(Fig. 10의 오른쪽)에 대해 매질효과 절대값의 분포 비율을 나타냈다. 마늘에서 IS를 적용하지 않을 때는 ≤20%에 37%, 21−40%에 48%, >40%에 15%의 농약이 분포했지만, IS를 적용하여 계산할 때는 ≤20%에 80%, 21−40%에 20%가 분포하여 매우 양호해졌다.
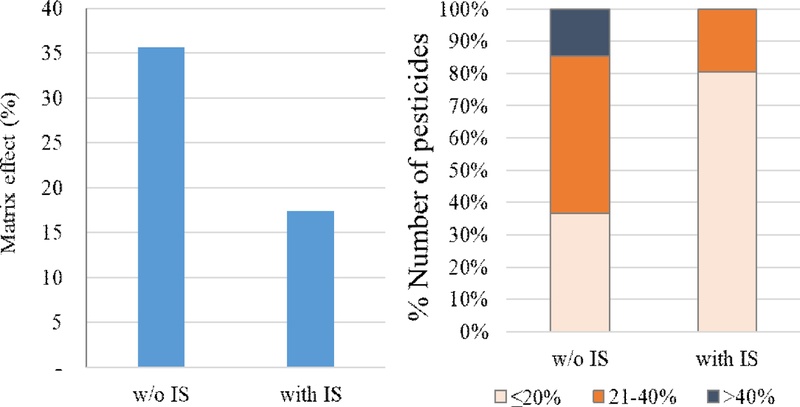
Matrix effect of permethrin (left) and number of pesticides distributed in each matrix effect range (right) in GC-MS/MS with and without peak normalization to IS for garlic extracts from grinding with dry ice.
결과적으로 마늘과 양파의 분쇄 및 추출조건별 매질효과는 두 작물에서 모두 상온> LN2> Dry ice 순으로 높았으며, 상온에서 오래 방치할수록 매질효과가 커짐을 양파에서 확인하였다. 또한 정제 과정에서 PSA 첨가 후 냉동, PSA 두배량 첨가, freezing-out 등은 유럽 공인 QuEChERS법의 PSA 표준량 처리와 효과가 비슷하거나 적었다. 따라서 -20oC에서 서서히 냉동하고 dry ice를 첨가하면서 분쇄하고 칭량 후 바로 용매를 첨가하는 것이 마늘과 양파의 잔류농약 분석에서의 매질효과를 효과적으로 줄일 수 있으며, 추후 다른 Allium 속 작물의 분석에도 적용 가능성을 검토할 수 있다고 판단되었다.
Acknowledgments
본 연구는 농촌진흥청 국립농업과학원 농업과학기술 연구개발사업(과제번호: PJ012217)의 지원에 의해 수행되었으며, 이에 감사드립니다.
이해상충관계
저자는 이해상충관계가 없음을 선언합니다.
REFERENCES
-
Anastassiades M., Lehotay SJ, Štajnbaher D, Schenck FJ, 2003a. Fast and easy multiresidue method employing acetonitrile extraction/partitioning and “dispersive solid-phase extraction” for the determination of pesticide residues in produce. J. AOAC int. 86:412-431.
[https://doi.org/10.1093/jaoac/86.2.412]

-
Anastassiades M, Maštovská K, Lehotay SJ, 2003b. Evaluation of analyte protectants to improve gas chromatographic analysis of pesticides. J. Chromatogr. A 1015:163-184.
[https://doi.org/10.1016/S0021-9673(03)01208-1]
-
Choi JY, Kim SH, Eun HR, Jeong WT, Lee SH et al., 2025. Impact of Sample Preparation Temperature on Matrix Effects in LC-MS/MS for Allium Crops Korean J. Pestic. Sci. 29:46-54.
[https://doi.org/10.7585/kjps.2025.29.1.46]
- European committee for standardization, 2018, EN 15662 : Foods of plant origin-Multimethod for the determination of pesticide residues using GC- and LC-based analysis following acetonitrile extraction/partitioning and clean-up by dispersive SPE – Modular QuEChERS-method.
- European Commission, 2026. Analytical quality control and method validation procedures for pesticide residues analysis in food and feed SANTE 11312/2021v2026. https://eurl-pesticides.eu/userfiles/file/EurlALL/SANTE-11312_2021-V2026.pdf, (Accessed June 18. 2026).
-
Hepperle J, Dörk D, Barth A, Taşdelen B, Anastassiades M, 2015. Studies to improve the extraction yields of incurred pesticide residues from crops using the QuEChERS method. J. AOAC int. 98:450-463.
[https://doi.org/10.5740/jaoacint.13-068]
-
Iitsuka Y, Tanaka Y, Hosono-Fukao T, Hosono T, Seki T et al., 2010. Relationship between lipophilicity and inhibitory activity against cancer cell growth of nine kinds of alk(en)yl trisulfides with different side chains. Oncol. Res. 18:575-82.
[https://doi.org/10.3727/096504010X12767359113965]
-
Kuettner EB, Hilgenfeld R, Weiss MS, 2002. Purification, characterization, and crystallization of alliinase from garlic. Arch. Biochem. Biophys. 402:192-200.
[https://doi.org/10.1016/S0003-9861(02)00088-7]
-
Lehotay SJ, Tully J, Garca AV, Contreras M, Mol H et al., 2007. Determination of pesticide residues in foods by acetonitrile extraction and partitioning with magnesium sulfate: collaborative study. J.AOAC Int. 90:485-520.
[https://doi.org/10.1093/jaoac/90.2.485]
-
Lehotay SJ, Cook JM, 2015. Sampling and Sample Processing in Pesticide Residue Analysis. J. Agric. Food Chem.63(18):4395-4404.
[https://doi.org/10.1021/jf5056985]
-
Li L, Zhao T, Liu Y, Liang H, Shi K, 2022. Method Validation, Residues and Dietary Risk Assessment for Procymidone in Green Onion and Garlic Plant. Foods 11(13):1856.
[https://doi.org/10.3390/foods11131856]
-
Payá P, Anastassiades M, Mack D, Sigalova I, Tasdelen B et al., 2007. Analysis of pesticide residues using the Quick Easy Cheap Effective Rugged and Safe (QuEChERS) pesticide multiresidue method in combination with gas and liquid chromatography and tandem mass spectrometric detection, Anal. Bioanal. Chem. 389:1697-1714.
[https://doi.org/10.1007/s00216-007-1610-7]
-
Schwimmer S, Mazelis M, 1963. Characterization of alliinase of Allium cepa(onion). Arch. Biochem. Biophys. 100:66-73.
[https://doi.org/10.1016/0003-9861(63)90035-3]
-
Tobkin HE, Mazelis M, 1979. Alliin lyase: preparation and characterization of the homogeneous enzyme from onion bulbs. Arch. Biochem. Biophys. 193:150-157.
[https://doi.org/10.1016/0003-9861(79)90018-3]
-
Urs W, Shaw ML, Lancaster JE, 1994. Effect of freezing upon alliinase activity in onion extracts and pure enzyme preparations. J. Sci. Food Agric. 64:315-318.
[https://doi.org/10.1002/jsfa.2740640311]
-
Wang JH, Xu Q, Jiao K, 1998. Supercritical fluid extraction and off-line clean-up for the analysis of organochlorine pesticide residues in garlic. J. Chromatogr. A 818:138-143.
[https://doi.org/10.1016/S0021-9673(98)00498-1]
-
Yoo KS, Pike LM, 2001. Determination of background pyruvic acid concentrations in onions, Allium species, and other vegetables. Scientia Horticulturae 89:249-256.
[https://doi.org/10.1016/S0304-4238(00)00196-5]
-
Zhang H, Chen Z, Yang G, Wang W, Li X et al., 2008. Microwave pretreatment and gas chromatography–mass spectrometry determination of herbicide residues in onion. Food Chem. 108:322-328.
[https://doi.org/10.1016/j.foodchem.2007.10.041]
Hyeyoung Kwon, Residual Agrochemical Assessment Division, National Institute of Agricultural Sciences, Rural Development Administration, Doctor of philosophy, Project administration, Supervision, Conceptualization, Investigation, Writing-original draft preparation, Writing-review & editing, https://orcid.org/0000-0003-0631-1996
Ji Won Lee, Residual Agrochemical Assessment Division, National Institute of Agricultural Sciences, Rural Development Administration, Researcher, Investigation, Writing-original draft preparation, Writing-review & editing, http://orcid.org/0000-0003-4203-0518
Min-seok Oh, Residual Agrochemical Assessment Division, National Institute of Agricultural Sciences, Rural Development Administration, Researcher, Investigation, http://orcid.org/0000-0002-2311-1956
Hyun Ho Noh, Residual Agrochemical Assessment Division, National Institute of Agricultural Sciences, Rural Development Administration, Doctor of philosophy, Investigation, http://orcid.org/0000-0002-7568-8490
Jeong Yoon Choi, Residual Agrochemical Assessment Division, National Institute of Agricultural Sciences, Rural Development Administration, Doctor of philosophy, Investigation, https://orcid.org/0000-0002-7931-6408
Haeri Han, Residual Agrochemical Assessment Division, National Institute of Agricultural Sciences, Rural Development Administration, Researcher, Investigation, http://orcid.org/0009-0003-8469-8847
Sung Eun Park, Residual Agrochemical Assessment Division, National Institute of Agricultural Sciences, Rural Development Administration, Researcher, Investigation, http://orcid.org/0009-0007-5727-2030
Sun Young Lee, Residual Agrochemical Assessment Division, National Institute of Agricultural Sciences, Rural Development Administration, Researcher, Investigation, http://orcid.org/0009-0002-8045-8873